Hello Educators! This is a Grade 6-7 math lesson, a part of the resources provided to educators in our Growing Math Project. It was previously featured on our site, but like with many of our resources, we’ve overhauled it for Growing Math!
Standards
CCSS.MATH.CONTENT.6.SP.B.5 Statistics & Probability: Summarize numerical data sets in relation to their context.
CCSS.MATH.CONTENT.7.RP.A.2.B Ratios & Proportional Relationships: Identify the constant of proportionality (unit rate) in tables, graphs, equations, diagrams, and verbal descriptions of proportional relationships.
Lesson Time
40- 50 minutes
Technology Required
Device with web-browser – Chromebook, laptop or desktop computer, iPhone or iPad
Summary
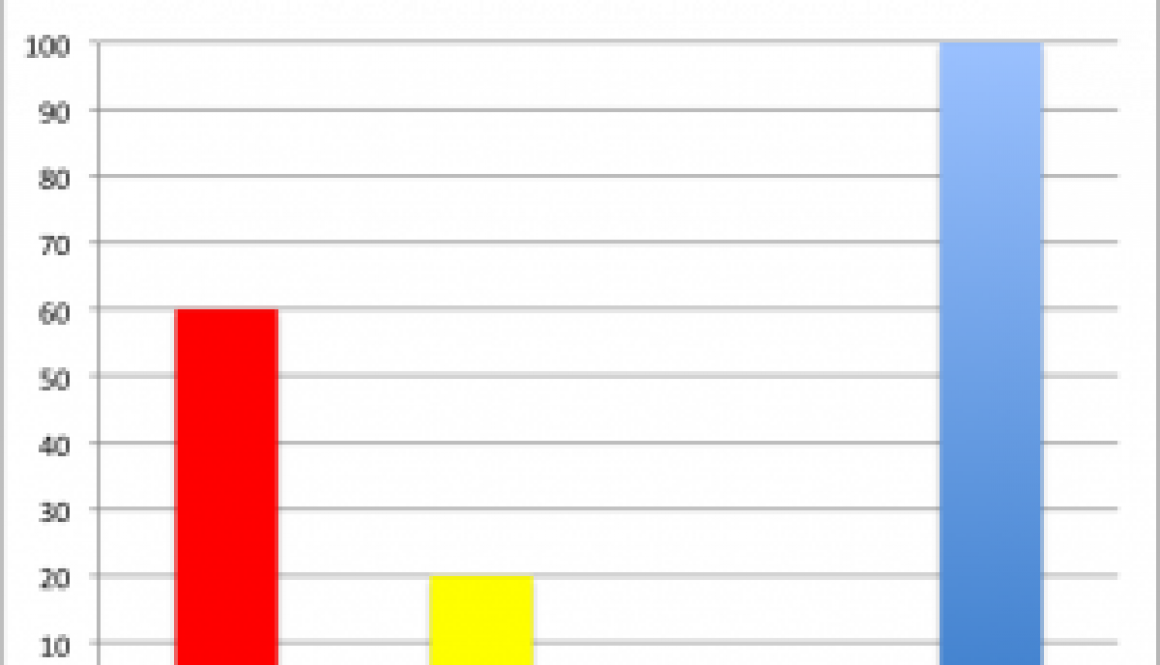
This activity is for Grades 6-7 and will introduce students to reading and comparing bar graphs with proportional relationships. Students complete a set of cards or complete activity in Google slides or Google doc.
Note: Business card stock may not be the best $10 I have spent as a teacher, but it’s high on the list. I don’t know what it is about cards that makes something seem like a game but I have had the greatest success with activities like this one.
Lesson Plan
Related lesson plan
If you have not watched the videos on Mayan Trading and Distributions, you may want to check out this lesson plan first.
Preparing for the lesson – Options
Print out the cards if students do not have home Internet access or if you want to use the cards to do the activity in class.
If students are learning from home, you can copy the Google slides presentation to your Google classroom and assign to students.
1. Individual Activity
Print out the “Graphs” page or display it using a Smartboard, projector or in your Google classroom. Each student / group is required to complete the cards using the graphs provided.
2. Class Activity
After the students have completed the assignment, which should take around 10-15 minutes, have students share their findings to these questions with the class. Discuss and review the different questions and answers that can come from the same set of data.
3. Play Games!
Students can play the AzTech Games to practice statistics in this history adventure game series. Links are available from the games page.
Assessment
AzTech Games Teacher Reports – Teachers can access standards-aligned student reports including answers to problems, number of correct answers, quiz results and pre-test/post-test results.
Students’ responses in the activities above, both individually and as a group, provide formative assessment of their ability at interpreting and extrapolating from graphical data.
State Standards
Minnesota Math Standard 7.2.2.1 – Represent proportional relationships with tables, verbal descriptions, symbols, equations and graphs; translate from one representation to another. Determine the unit rate (constant of proportionality or slope) given any of these representations.
How to Join Growing Math
These digital lessons and the games are available for free from Growing Math, our new platform for Grades 3-8. If you are located in New Mexico, Arizona, Oregon, North Dakota, South Dakota, or Minnesota and teach Grades 3-8, you can participate in our training to get Growing Math digital resources and our collection of math games. Email us at growingmath@7generationgames.com or fill out the contact form.
Click Getting Started below to learn more: