As I mentioned in another blog, I’m teaching statistics to Fine Arts majors next semester and I decided the best way was NOT to have them compute the area under the normal curve between two z-scores. So, what am I doing?
I’m starting in the first place by asking statistical questions, that is, a question that could be answered with statistics.
For example, I’m thinking of starting a new company that sells documentary films to schools. (I’m not, really, this is an example).
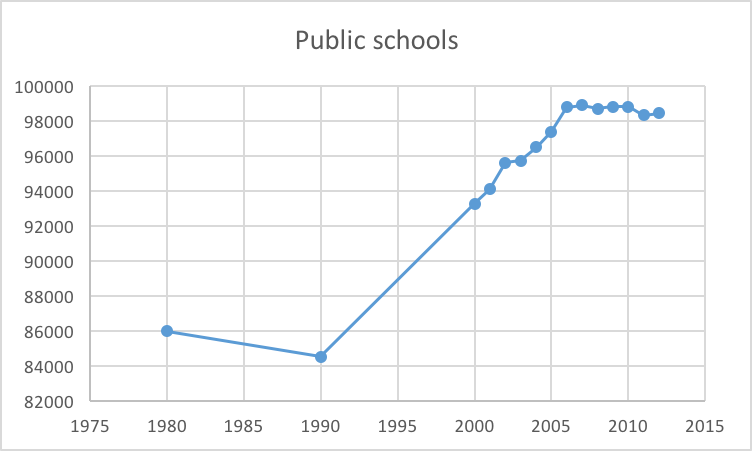
I downloaded this data set from SAS Curriculum Pathways, by the way, which is a useful source for lots of data and free statistics lessons.
Based on these data, I want students to tell me if the education market is increasing, decreasing or staying the same.
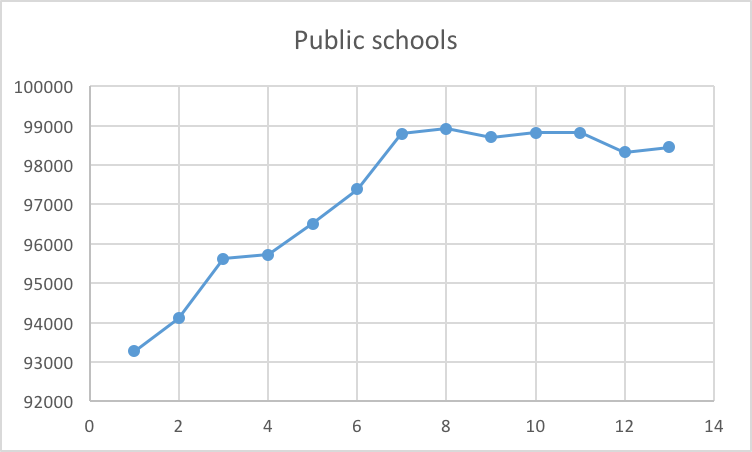
What if they just graphed the last 13 years, do they come to the same conclusion?
I have a reason for starting out like this. I want students from the very beginning to see statistics as telling you something, answering a question.
Teach statistics? Like statistics? If the answer to either question is yes, check out Aztech: The Story Begins in the app store.
Math, Spanish, and Latin American History collide in this new adventure! Aztech: The story begins. Free in the App Store.