Dates on the calendar are closer than they appear! I know you just got out of school a week ago, or maybe you still have a few days to go. Lesson plans to teach statistics are the last thing you want to think about. Trust me, you’ll thank me later. Book mark this page. If you are not subscribed to our newsletter – subscribe! Just save them in a folder for August when you are wishing you had done all that lesson planning you meant to do over the summer.
Games that Teach Statistics – Play these now! Maturity is so over-rated!
AzTech: The Story Begins – The average number of students in Mr. Gonzalez’ classes has been going down. Where did they go? More importantly, will they be able to use their knowledge of math and history to make it back? Plays on the web and on iPad.
Forgotten Trail – Follow two teenagers who apply their knowledge of fractions, decimals, measurement and statistics to retrace the Ojibwe migration through the U.S. and Canada.
Statistics Videos
Bar Graphs Videos (and 1 pictograph)
Reading a pictograph – Pictographs are a fun, easy introduction to graphs. This video shows how to use a pictograph to answer questions, like how students get to school.
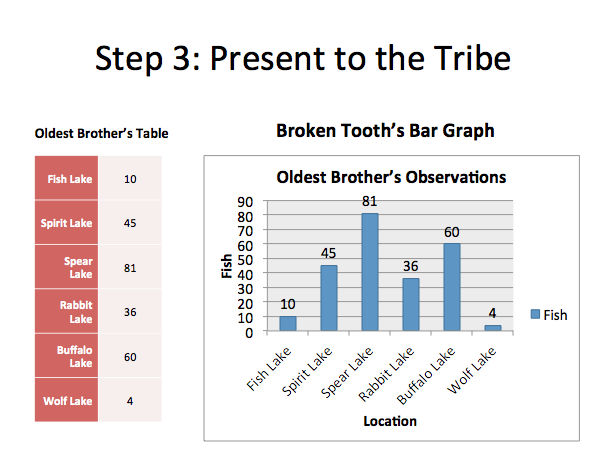
Answering questions with bar charts – Dr. Longie answers questions about the buffalo and keeps Mean Mena from getting him fired.
Mayan Trading – Learning about distributions using bar graphs with examples from Mayan trading.
BONUS : Available in Spanish – El comercio Maya
Why did the Maya Hunt? – What’s an X axis? What’s a Y axis? Another example of using bar graphs, explaining Mayan hunting practices.
BONUS: Available in Spanish ¿Por qué cazaban animales los Maya?
Central Tendency Measures Video
Finding the average – What is the mean? Can you sing the formula for it? Neither can our president but that didn’t stop her from trying.
BONUS: Available in Spanish – extra bonus, no singing. Encontrando el Promedio.
Distributions and Variability Video
Explaining Distributions and Variability – How can knowledge of distributions save you from angry, spear-wielding villagers? Watch this video from the AzTech Games series to find out.
BONUS : Available in Spanish.
Statistics Presentations
Bar Graphs PowerPoint Presentations (and 1 pictograph)
Reading A Pictograph – How to use a pictograph to answer questions, for example, what transportation do students use to get to school? IN SPANISH: Leer un pictograma Don’t have PowerPoint and want it as a a PDF? Here you go: Reading a pictograph IN SPANISH: Leer un pictograma
Understanding Bar Graphs – How do you read a bar graph? An example using a problem from the game, AzTech: Meet the Maya Don’t have PowerPoint? Get it as a PDF
Mayan Hunting To Teach Bar Graphs Using bar graphs to solve problems. IN SPANISH: Por qué cazaban animales los maya
Want it as a a PDF? Here you go: Mayan hunting – PDF in SPANISH: Por qué cazaban animales los maya
Central Tendency Measures Presentations
Finding the average – Short, simple explanation and an example of finding the average.
BONUS: IN SPANISH: Cómo encontrar el Promedio Have it as a PDF? Want the PDF in Spanish? Cómo encontrar el Promedio
Median – What’s a median and how do I find one? IN SPANISH: Mediana es el número que está en el medio
Want it as a PDF? Here it is in English and here is the PDF in Spanish .
Distributions
Introducing Distributions – How can a confusion in the distribution of different trading items lead to angry villagers throwing a spear at you? Here is an example of distributions from AzTech: Meet the Maya. IN SPANISH: Introducción a las distribuciones
Don’t have PowerPoint and need a PDF? Download here. or PDF IN SPANISH: Introducción a las distribuciones